Heatmaps can tell you a lot about how visitors view and interact with your website.
Here you’ll learn:
- How heatmapping is defined
- Why heatmaps are important
- Ways marketers can use heat maps
- Heatmapping best practices
You’ve built a high-quality website, implemented on-page and technical SEO tactics, designed excellent calls to action (CTAs), and posted valuable content.
But if, after all that, you’re still not seeing your desired results? One of the ways to find out why is to use heatmapping.
A heat map (or heatmap) is a color-coded map of your website that demonstrates which elements or sections your visitors interact with and which areas they ignore. By implementing heatmapping tactics, you can better identify problem areas and fix them, improving conversion and retention.
Let’s take a closer look at what heatmapping is all about.
A heatmap example from Wikipedia. (Image: Wikipedia)
What is a website heatmap?
A heatmap paints a picture of how visitors interact with your website. This tool is popular in different areas of data processing, including statistics. Basically, it’s a graphic representation of your data with colors.
While you can get valuable info about user activity with traditional tools such as Google Analytics, a colored map can give you a deeper, more visual insight.
A heatmap allows you to identify website elements people are gravitating towards and which are going unnoticed.
Several providers offer heatmapping tools, including:
Most of them have free versions that allow you to get a glimpse of how this method works.
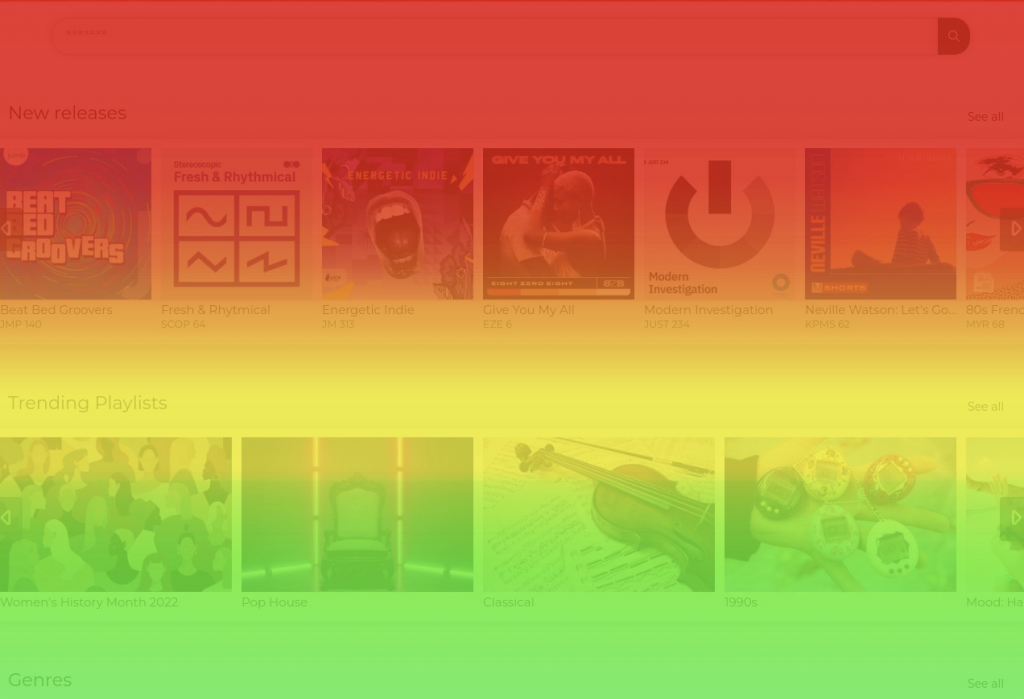
Once the map loads, you can see the level of engagement with different elements of a webpage demonstrated by colors.
Depending on the tool you use, the warmth of colors usually depends on the intensity of the activity. For example, active areas of your website are red and orange, while less active ones are green and blue.
Different types of heatmaps include:
Click maps
These are the most popular heatmap types. They show you where visitors click on a webpage so you can see which elements get many clicks and which don’t get any clicks at all. These maps are excellent for monitoring effective CTA buttons.
Scroll maps
Scroll maps demonstrate your visitors’ scrolling behavior on each web page. They can let you know how many users check your pages from top to bottom and how many don’t make it all the way down. These maps can also help you figure out where visitors usually stop scrolling.
Mouse-tracking maps
These maps track general mouse movement. They can help you note which areas of your webpage cause these movements. Erratic mouse movement may demonstrate frustration. Meanwhile, hovering could mean areas of interest.
Dead-click maps
Some elements of your webpage may resemble buttons and cause users to click on them. This results in misunderstanding and frustration. Dead-click maps can help you figure out where these elements are so you can replace them.
Device maps
These maps can help you compare the activity of your visitors on different devices. For example, they could be scrolling down the entire page on desktops but stop in the middle on mobile devices. This could indicate design issues for your website’s mobile version.
Each heatmap carries value to your marketing team, UX designers, and data analysts. They provide an added layer of insight into user behavior and help point out marketing and design errors you may not have otherwise noticed.
Heatmaps can save you time by creating a picture of something that could take hours to understand with raw data. (Image: Rawpixel)
Why you need heatmapping
Heatmapping can help you analyze user behavior on your website and identify possible problem areas, including:
- Poorly designed or placed CTA that users never click
- Which content on your website visitors never see
- Non-clickable elements that distract users or cause rage clicks
- How much of your website visitors actually see
- False bottoms (visitors think they’ve reached the bottom of the page but really didn’t)
- Areas that cause user friction
Besides problems, heatmapping can also help you identify which parts of your website are doing a great job attracting and converting visitors. You can use this information to design other areas of your website, understand what visitors want to see, and improve personalization.
Heatmaps can also save you time by creating a picture of something that could take hours to understand with raw data. Just one glance at a heatmap can provide valuable insight that dozens of graphs and tables can’t.
These maps are also great for demonstrating marketing efforts and achievements to someone who may have trouble reading raw data. Marketing teams could use heatmaps for reports to the management.
It’s important to understand that, while useful, heatmapping can’t be the main tactic you base your analytics on. It’s easy to misinterpret some of the heatmaps. For example, you could mistake rage clicks for positive attention. That’s why they should be analyzed in combination with other data.
3 best practices for website heatmaps
Here are a few things to do when using heatmaps:
1. Try to narrow down your goal
Before analyzing a heatmap, figure out which problems you need to identify. If you don’t have a clear question for the heatmap, you may get too much unnecessary information that could hinder or muddle your tactics.
2. Start small
Using heatmaps on all of your webpages isn’t necessary. Check Google Analytics to figure out which pages need your attention. Keep in mind that heatmaps may slow down your website.
3. Make sure you have enough data
Heatmaps can give you valuable insight only after a sufficient number of visitors come to your website. Analyzing too little data with a heatmap could lead to wrong conclusions.
The takeaway
Heatmapping is a valuable website analytics solution that can help you gain insight into website design and user behavior.
By using this tool on some of your web pages, you can make important adjustments, reduce bounce rates, and increase the number of conversions.
While this method can be highly useful for marketers, it shouldn’t be used in a silo. To make decisions, it’s best to leverage them in tandem with other analytics and data-gathering tools.